- 714.396.2819
- Email Me
- My Dashboard
Advanced Search
Orange County Market Update – Is it Still a Sellers Market?
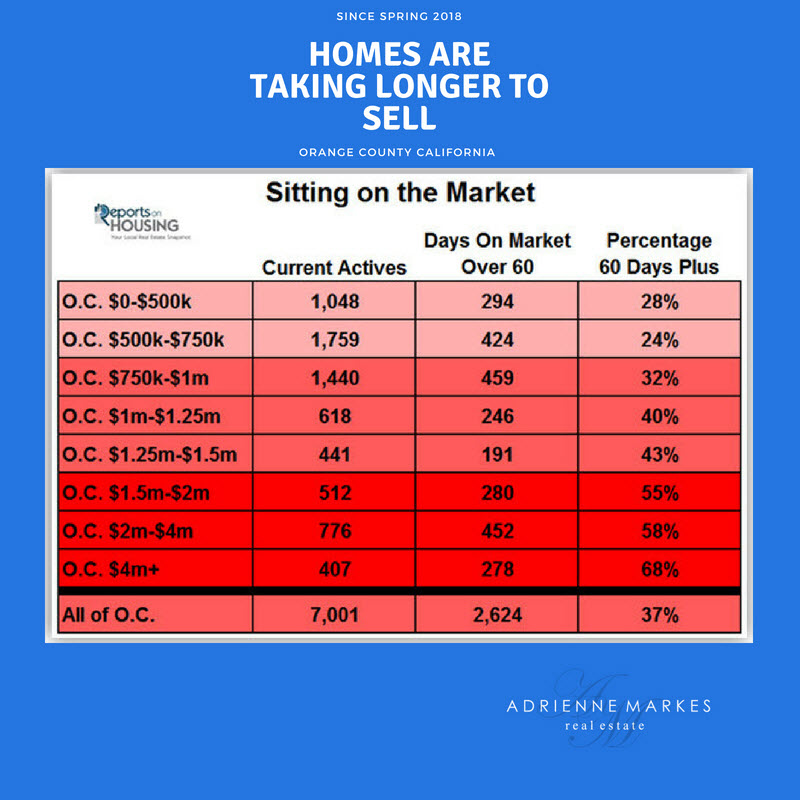
Sitting on the Market: A surprising 37% of the active listing inventory has been on the market for more than two months.
For years, sellers have been in control of the housing market. Multiple offers were generated almost instantaneously after hammering in the FOR SALE sign. Homes flew off the market in the blink of an eye. Frustrated buyers had to cut back their expectations after writing offer after offer with no success. It felt like housing was unstoppable and would continue its relentless climb. That is until the spring of 2018.
This year has been all about the evolution of housing from a brisk paced, hot, Seller’s Market to a much more normal, Balanced Market. The trouble is nobody really remembers a “normal” market. It is where homes must be priced well, or they will sit. There is no room for error. In a hot seller’s market, homeowners get away with stretching their asking prices. With very little inventory and heated demand, buyers were willing to pay extra just to secure their piece of the “American Dream.”
Today, housing is much more balanced, a market that does not favor sellers or buyers. Overprice and sit. Sellers that pad the price to leave room for negotiations will sit. Sellers who ignore their professional REALTOR® and arbitrarily pick a price, will sit. Ignore real estate fundamentals like location, condition, and upgrades, and sellers will be stuck without success.
An unbelievable 37% of all homes on the active listing inventory have been exposed to the market for more than 60-days. That is high considering 39% of the active listing market has come on within the last 30-days. Of course, everyone expects Sellers in the luxury ranges to play the waiting game; however, many sellers in the most affordable price ranges are sitting on the market and waiting as well. Below $500,000, it is 28% of the market. Between $500,000 and $750,000, it is 24% of the market. About a third of all sellers between $750,000 and $1 million have been on the market for over two months. From there, the share of sellers who have been waiting to find success grows, from 40% to 68%.
For the rest of the year, the percentages will just grow in every price range. That is because housing is now transitioning into the Autumn Market. This season of real estate begins with the kids going back to school. It is no longer the most advantageous time for families to move, so many would be buyers stop their search for the time being. On average, demand drops by 11% from the end of August to the start of October. With less demand, there are fewer sellers who are able to find success. As a result, more sellers find themselves sitting and waiting.
With both the Spring and Summer Markets in the rear view mirror, many sellers realize that the best time of the year to sell is now in the past. For the remainder of the year, carefully pricing is absolutely crucial. There will be more homeowners this year who will not be able to isolate a buyer willing to purchase and their contracts to sell will expire. In the real estate trenches, they are called “expired listings.” Expect the number of expired listings this year to spike compared to the rest of the housing run.
Sellers have a choice: price their homes according to the Fair Market Value or throw in the towel and pull their homes off of the market. It sounds simple, but many sellers quite simply cannot get out of their own ways, unwilling to listen to the real estate experts and do what it takes to achieve their goals in selling.
Buyers need to be aware that while it is no longer a hot seller’s market, it is not a buyer’s market either. Looking for a “deal” is a waste of time. They too need to look at offering to purchase at a home’s Fair Market Value. Anything less, and they will not be successful in securing their piece of the “American Dream.”
In either case, your REALTOR® can provide you with the most recent data that supports your asking price or purchase price according to the current sales in the area to help you make informed decisions.
Active Inventory: The active inventory grew by 2% in the past two-weeks.
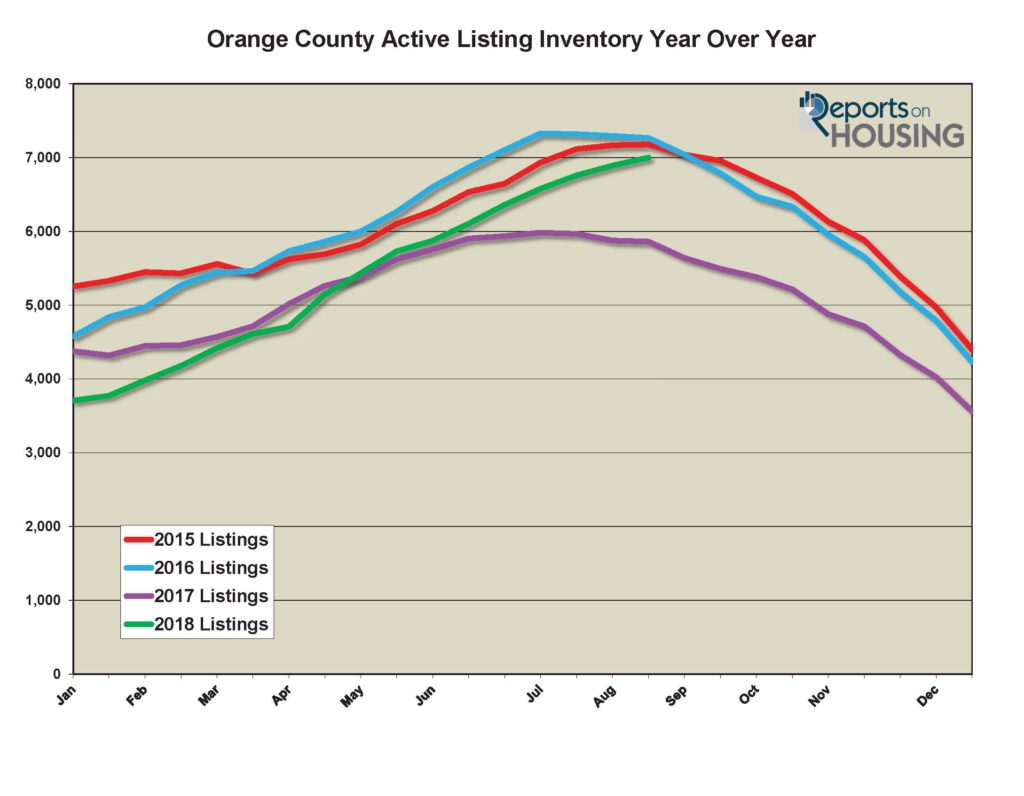
The active listing inventory continued its climb in the past two-weeks, adding 108 homes, or 2%, and now totals 7,001, eclipsing the 7,000 level for the first time since September 2016. This may be the peak for the active listing inventory for 2018. From here, housing transitions into the Autumn Market with fewer homes entering the fray and many sellers throwing in the towel and pulling their homes off the market after not finding success in both the spring and summer. Although it is technically not autumn until Saturday, September, September 22, the Autumn Housing Market starts now, as the kids go back to school, and runs to Thanksgiving. From there, the market downshifts further and transitions into the Holiday Market when even fewer homeowners opt to sell their homes.
Last year at this time, there were 5,862 homes on the market, 1,139 fewer. That means that there are 19% more homes available today. The year over year difference continues to grow each week. The trend of more homes on the market year over year is here to stay.
Demand: Demand dropped by 2% in the past couple of weeks.
In the past two-weeks, demand, the number of pending sales over the prior 30-days, decreased by 44 pending sale, 2%, and now totals 2,350, the lowest demand reading for this time of the year since 2007. This year the emphasis of a supply problem, not enough homes on the market, has evolved to a demand problem, not enough pending sales. With higher mortgage rates and higher values, buyers are not as excited to purchase as they have been over the past 6-year run.
Last year at this time, demand was at 2,825 pending sales, 20% more than today, or 475 additional pending sales.
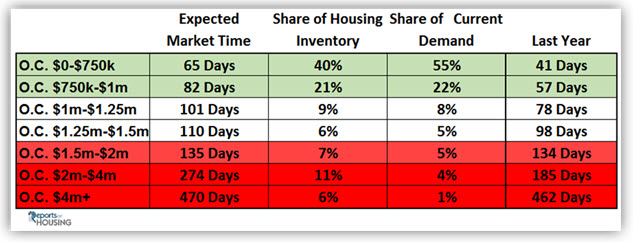
The expected market time, the amount of time it would take for a home that comes onto the market today to be placed into escrow down the road, increased from 86 to 89 days in the past two-weeks. Last year, the expected market time was at 62 days, substantially hotter than today.
Luxury End: Luxury demand increased over the past two-weeks.
In the past two-weeks, demand for homes above $1.25 million increased by 14 pending sales, up 4%, and now totals 345, its highest level since the end of June. It’s still down 21% from the end of May height in luxury demand. The luxury home inventory decreased by 19 homes and now totals 2,133. The overall expected market time for homes priced above $1.25 million decreased from 195 to 185 days over the past two-weeks.
Year over year, luxury demand is down by 40 pending sales, or 10%, and the active luxury listing inventory is up by an additional 131 homes, or 7%. The expected market time last year was at 156 days, much better than today.
For homes priced between $1.25 million and $1.5 million, the expected market time increased from 93 to 110 days. For homes priced between $1.5 million and $2 million, the expected market time decreased from 183 to 135 days. For homes priced between $2 million and $4 million, the expected market time decreased from 294 to 274 days. For homes priced above $4 million, the expected market time decreased from 523 to 470 days. At 470 days, a seller would be looking at placing their home into escrow around December 2019.
If you’re thinking about selling your house in the near future, you can request a free home value report here. If you are renting, find out how to start building your net worth and start owning.
CalBRE #: 01808009