- 714.396.2819
- Email Me
- My Dashboard
Advanced Search
List Price vs Sell Price – What This Means To You
Whether you are a buyer or seller, this information is important to understand so you know how to position your offer or respond to an offer. The graph below represents homes sold in San Clemente, CA from Nov. 1, 2010 – today.
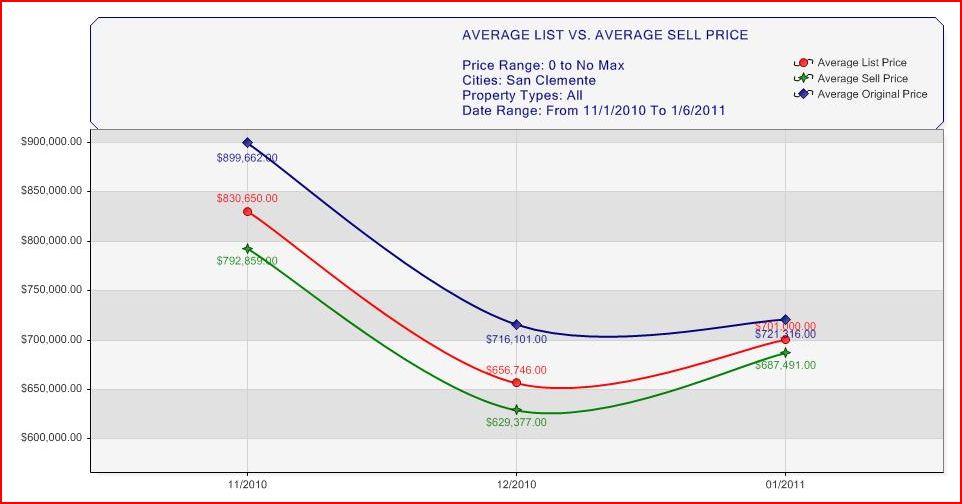
The red and green lines are where you need to focus. The red line is what the seller finally dropped their price to (after starting at the blue line). The green line represents what the home actually sold for. Here is why this information is important.
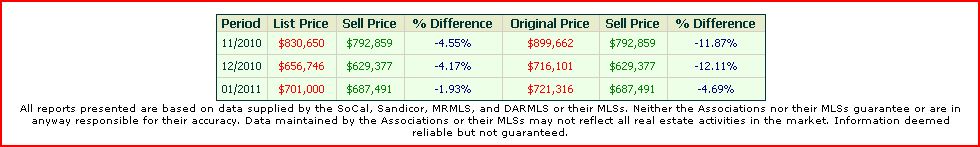
If you are a seller, you need to be aware of what the market is willing to pay for your property. In November, offers that actually went under contract and closed where 4.55% LESS than the list price. In December it moved to 4.17% less. We are very early in the month of January, so those numbers may be a bit skewed. Bottom line is, if you are trying to sell your home quickly, you should ask your Realtor® to provide these statistics so you can position your home to go under contract as fast as possible. Don’t be greedy
If you are a buyer, you also need to be aware of these numbers. If you see a home you like and want your Realtor® to write an offer at 20% discount when the market is showing a trend of 4.55%, you’re wasting every one’s time. If you see a house you love ask for these statistics so you can make an appropriate offer based on the current market conditions and have a good chance of it being accepted. Don’t be greedy.
CalBRE #: 01808009